How to log and monitor your app with a non-intrusive solution using Grafana, Loki, and Fluent Bit
Hey folks,
The other day, I was talking about my QoS journey and my work on implementing a Virtual Router Redundancy Protocol (VRRP)-like solution using Node.js and Bun. More info here:
https://iiaku.com/2024/12/08/how-to-ensure-a-more-reliable-isp-fiber-connection-with-failover/
I wanted to add a way to monitor my app, which natively logs to stdout using Pino. Initially, I considered a myriad of tools to achieve this. The thing is, most logging tools are primarily tracing-oriented. You can think of standard OpenTelemetry, as well as other open-source or proprietary solutions like Sentry, New Relic, and Better Stack.
Pino - Super fast, all natural JSON logger for Node.js
However, (at least for now) I didn’t need all those extra features like tracing or debugging—I just needed logging and monitoring. Another key requirement was the ability to set up alerts. I tried New Relic, but in the end, I wasn’t entirely comfortable sending my data to their servers. Another issue was that their alerting integration didn’t work as expected (at least on the free plan I was using).
Sentry was a good option, but it included extra features that didn’t align with my needs. Better Stack does offer a logging-only solution, but since it comes with a paid plan, I wanted a way to retain a good history of my logs without limitations. Ultimately, a self-hosted solution seemed like the best fit.
OpenTelemetry Application Performance Monitoring & Error Tracking Software Telemetry (formerly Logtail) | Better Stack
My Self-Hosting Journey with Loki, Grafana, and Fluent Bit
Naturally, I reached a point where using the open-source Loki + Grafana became a very good option.
_Loki is a log aggregation system designed to store and query logs from all your applications and infrastructu_re
Grafana Loki OSS | Log aggregation system
Grafana is an open-source platform for querying, visualizing, alerting on, and understanding your data, no matter where it’s stored. It allows you to create, explore, and share insights through beautiful and flexible dashboards
Grafana | Query, visualize, alerting observability platform
Fluent Bit is a super fast, lightweight, and highly scalable logging, metrics, and traces processor and forwarder. It is the preferred choice for cloud and containerized environments.
rom that, I had my base stack.
Pros of this setup:
- Open-source
- Can be self-hosted on a machine of your choice for free
- No log ingestion limits (only your hard drive space is the limit)
- Relatively easy to set up
- Part of the Grafana ecosystem
- Extensible and highly configurable
- Built-in alerting features
Cons:
- Requires manual setup
- You need to manage, upgrade, and maintain the stack yourself
- System monitoring may be necessary
For example, I initially set up the Grafana stack using Docker Compose, but one day, the stack went down for some reason. Since then, I’ve had to set up an alerting check on the container using Uptime Kuma to stay informed whenever something goes wrong with the stack.
The Setup
For the Grafana + Loki part, I simply followed the guide and chose the Docker Compose option.
Install Loki with Docker or Docker Compose | Grafana Loki documentation
This is running locally on my NUC. For monitoring the stack, I also added a container-based Uptime Kuma setup.
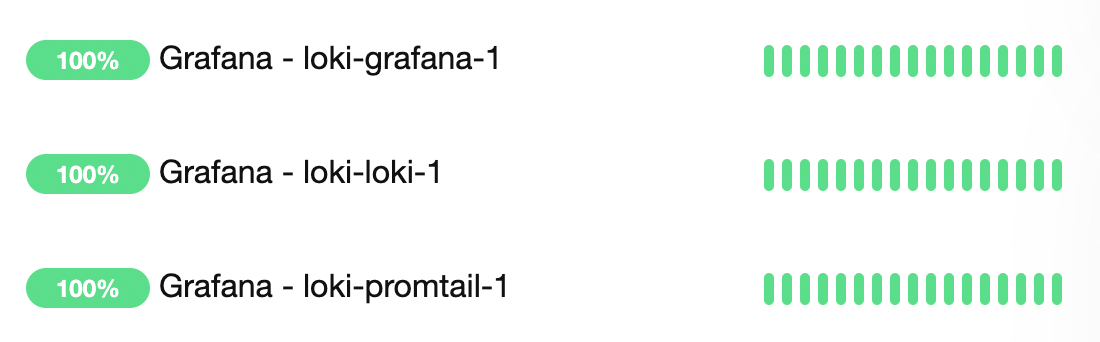
This is how my three containers for monitoring look. Uptime Kuma supports a variety of monitoring options, and you can receive real-time alerts through different destinations like Slack, Telegram, email, etc.
As for Fluent Bit, it’s essentially the tool that sends your logs to your chosen destination. The great thing about it, compared to other options I mentioned earlier, is that Fluent Bit allows you to export logs to one or multiple destinations without needing to add extra code to your application. This is nice because, in my opinion, it’s a non-intrusive way of exporting logs. It doesn’t affect your codebase or impact the performance of your application. Your app is already in production, and it natively produces logs through stdout, so you can send them wherever you want. 😄
Fluent Bit uses a configuration file system where you can define the logging flow (at least, this is how I understand the tool).
On a linux/ubuntu based system how to setup ubuntu
Ubuntu | Fluent Bit: Official Manual
When you have located your Fluent Bit binary, created your service, and it is up and running:
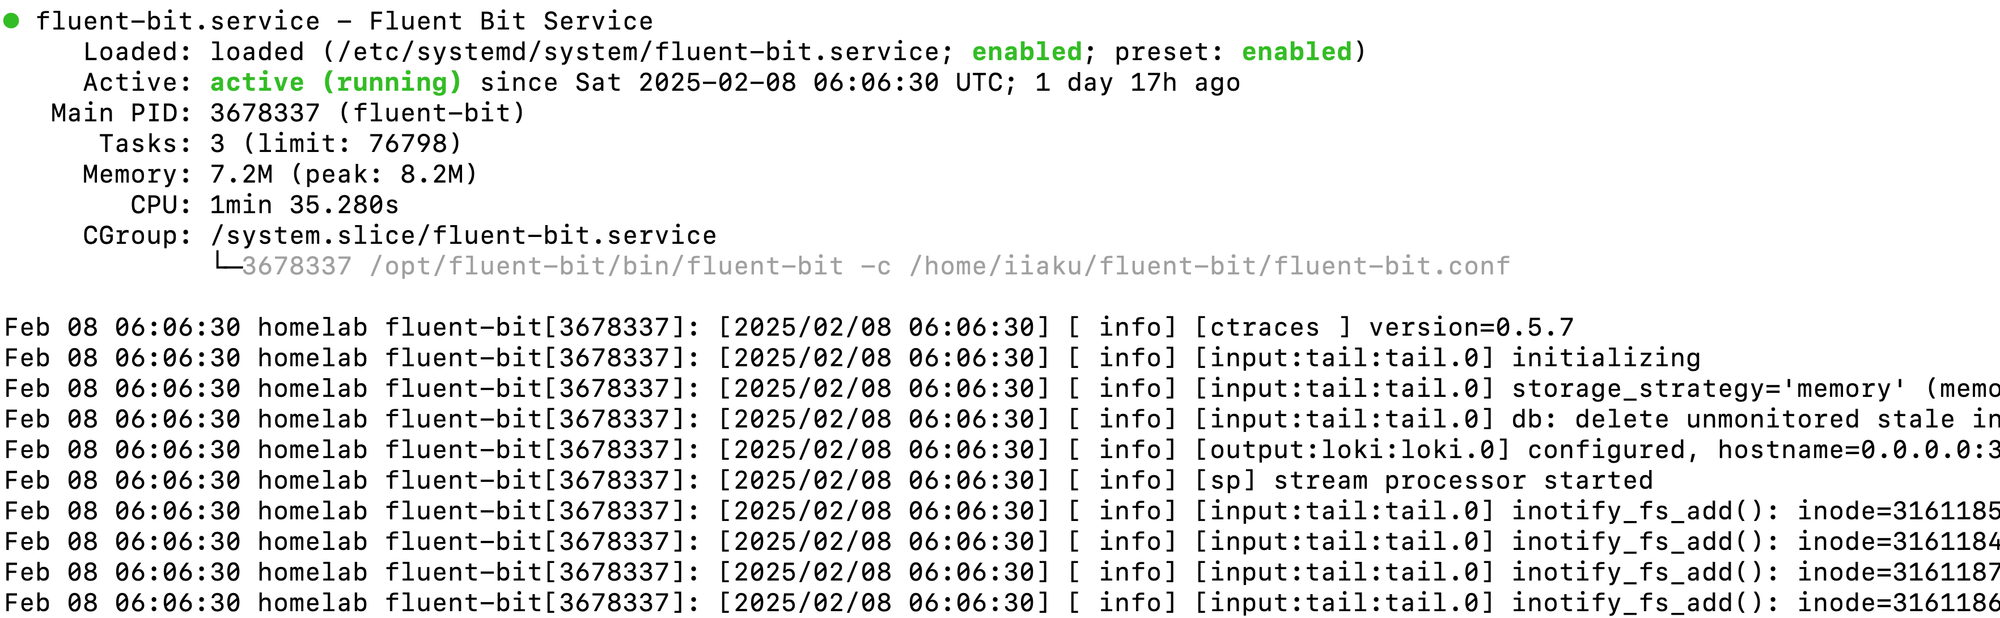
Then, you’ll need to set up a configuration file, e.g. fluent-bit.conf
[SERVICE]
  Flush         1
  Log_Level     info

[INPUT]
  Name          tail
  Tag           pm2
  DB            /home/iiaku/.pm2/logs/*.log.db
  Path          /home/iiaku/.pm2/logs/*.log

[OUTPUT]
  name          loki
  match         *
  host          0.0.0.0
  port          3100
  drop_single_key raw
Here’s how my config looks. It’s pretty simple, and there may be other options I could be interested in, but this is doing the job.
In the input section, you can see that I’m streaming my PM2 logs to the output, which is Loki.
As a reminder, PM2 is the process manager I use to run my Node.js app on my server.
Then, you set your config like this:
# path_of_fluent-bit_binary -c path_of_your_conf

/opt/fluent-bit/bin/fluent-bit -c fluent-bit.conf
If needed, you can start or restart Fluent Bit, and you should start receiving your logs in Grafana.
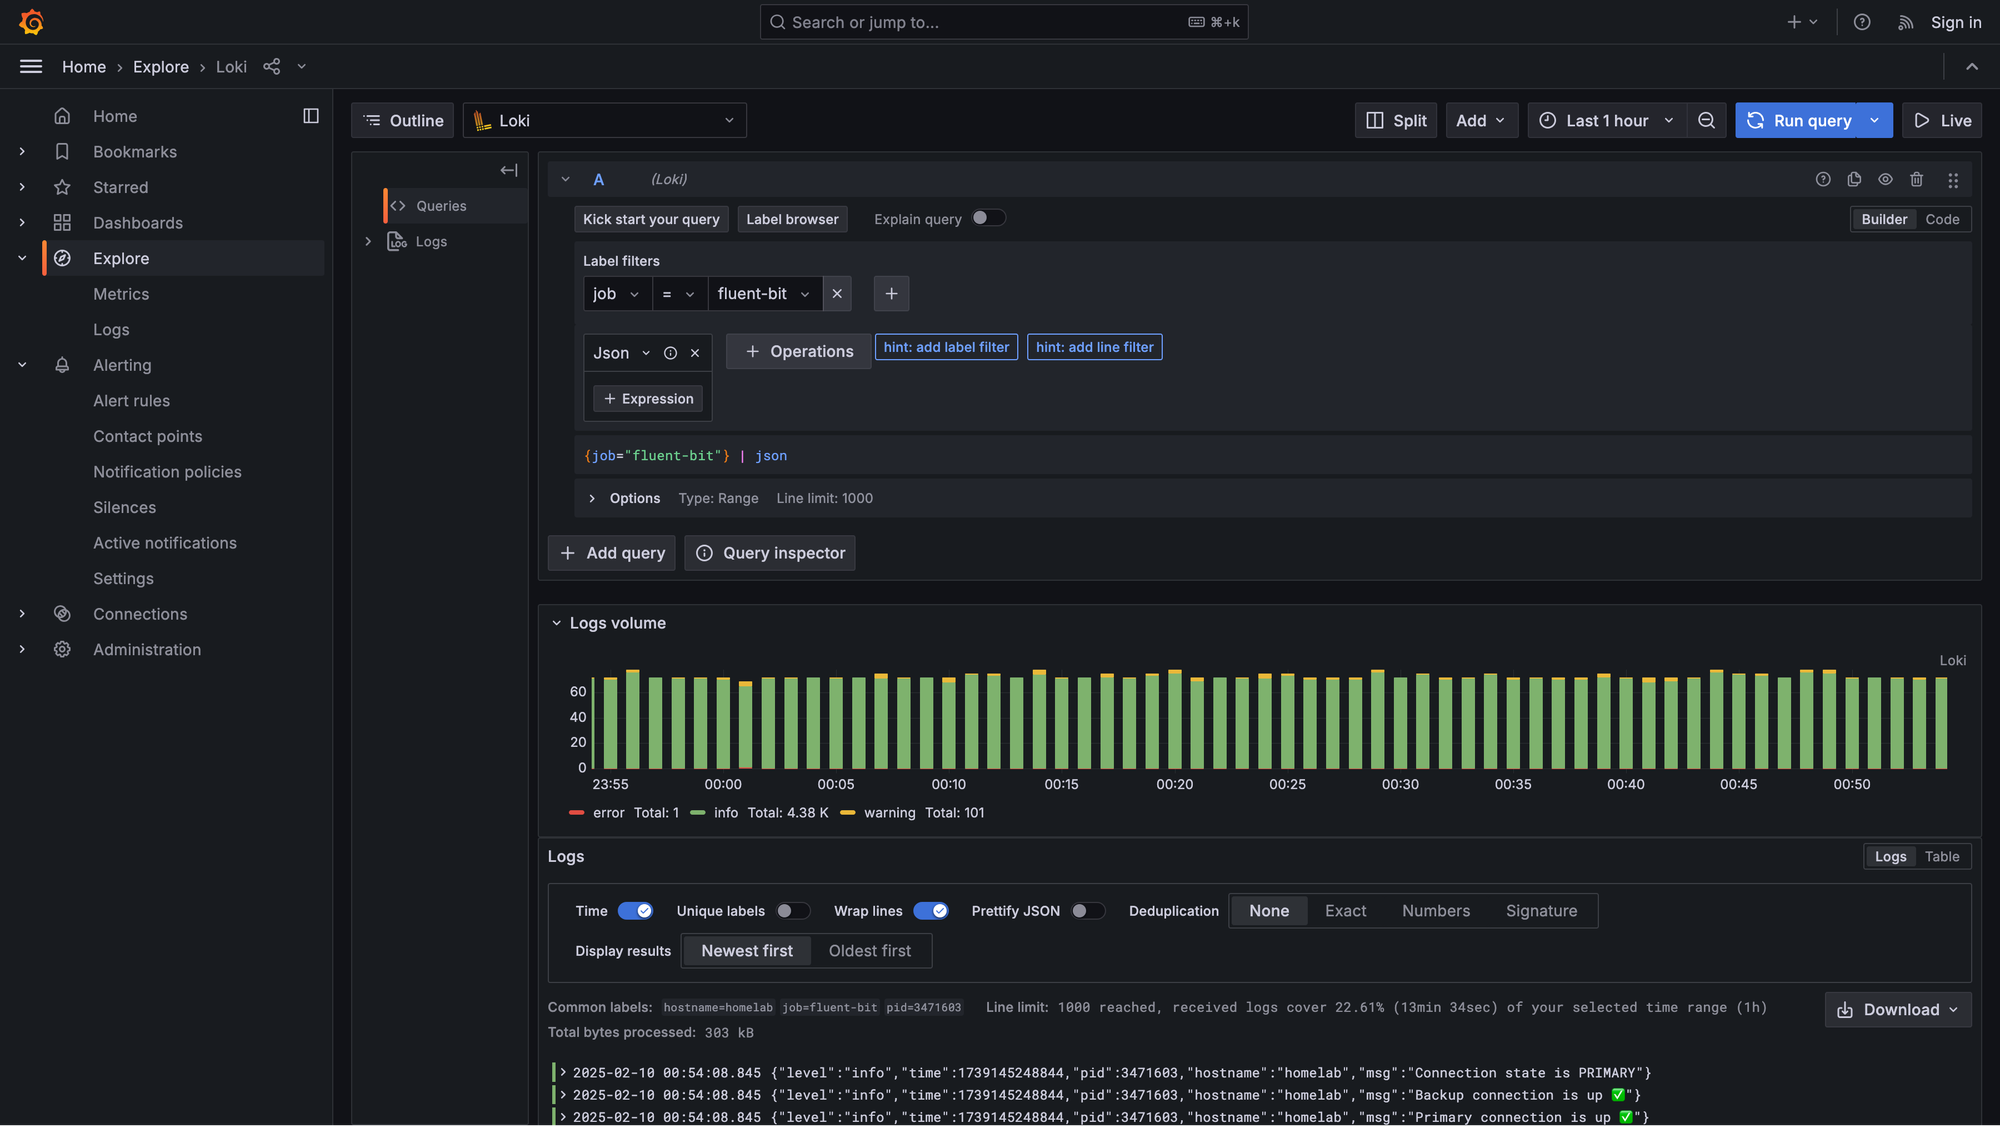
This is how it looks in my Grafana. In the following screenshot, I’m filtering the data as JSON, which allows me to filter by field (e.g., log level = warn).
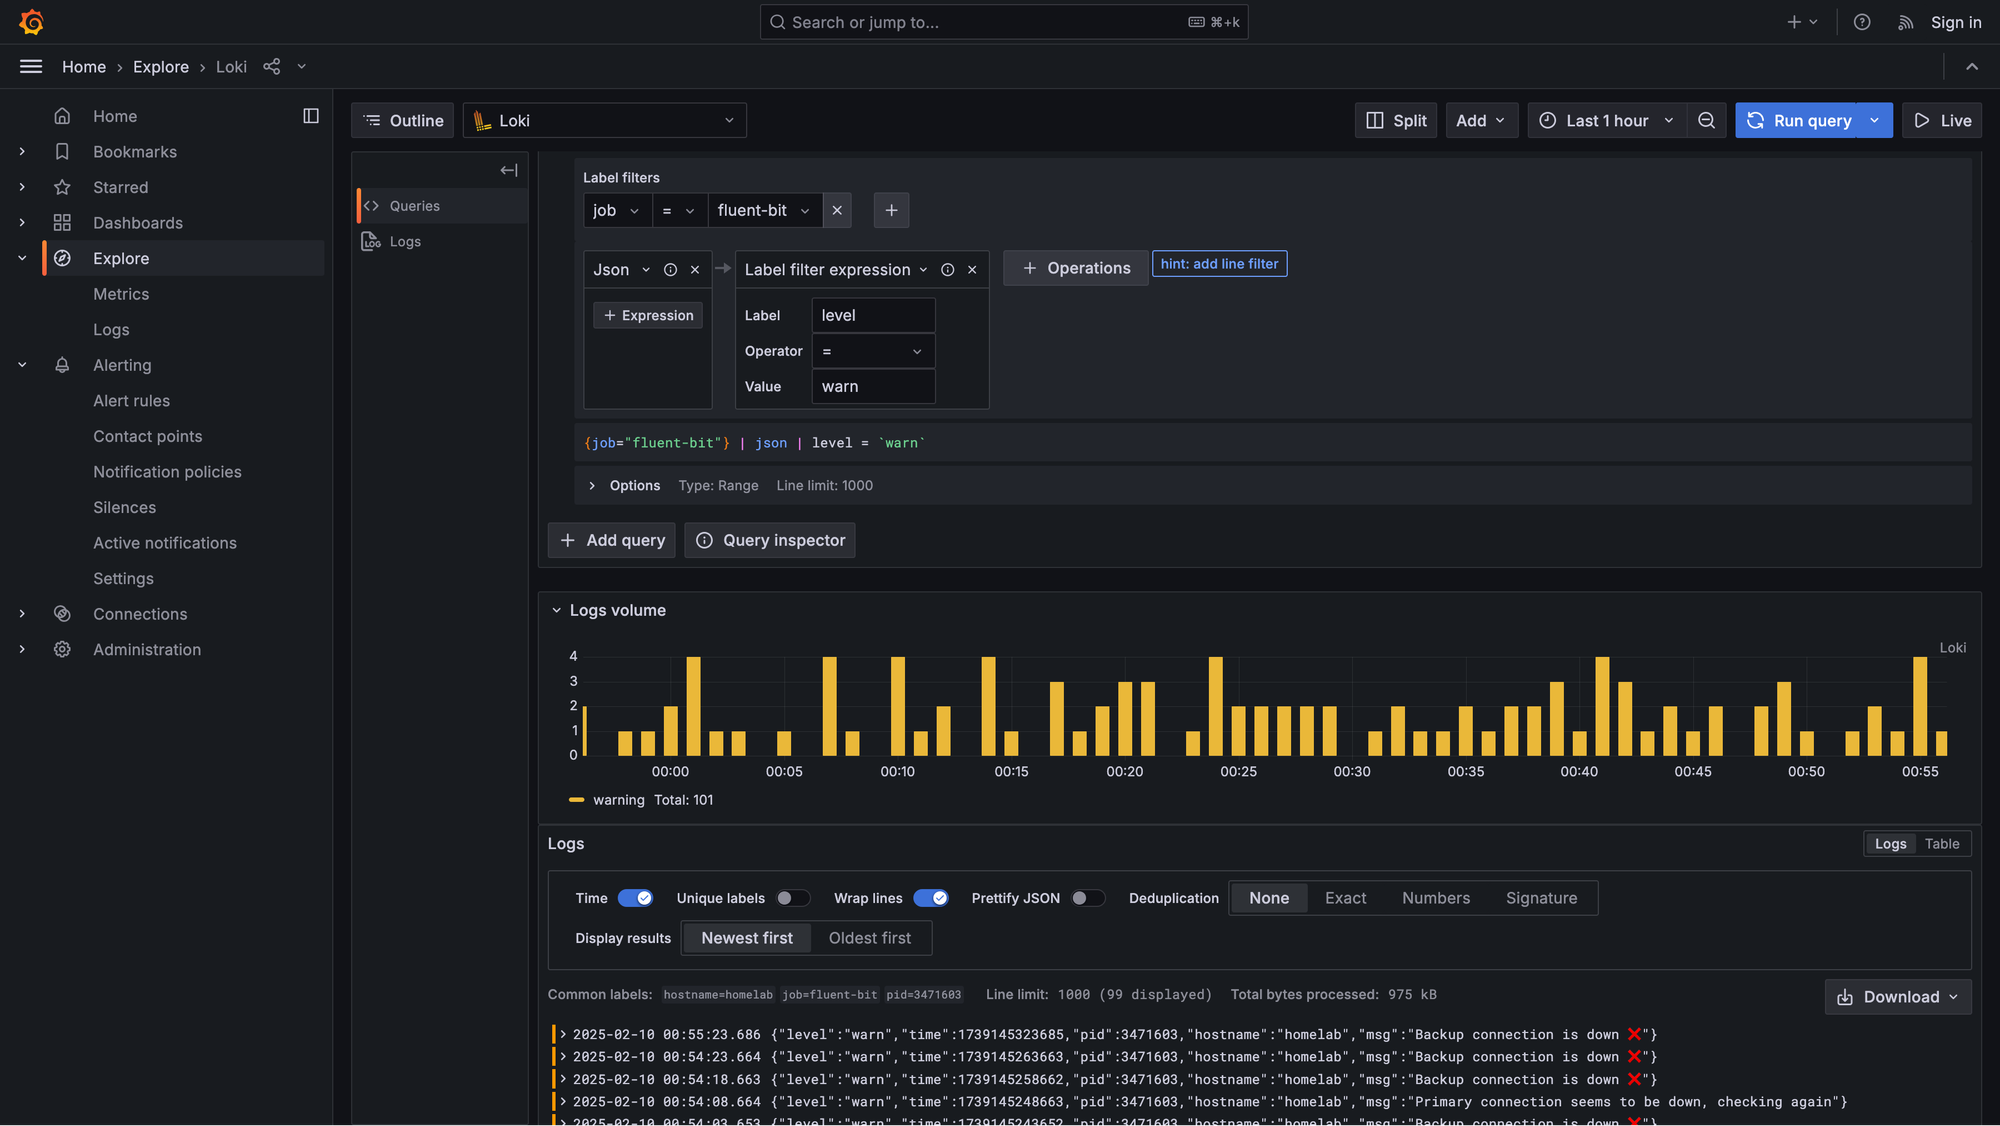
As you can see on the left panel, there is the Alerting section where you can set a variety of rules and policies to trigger alerts based on your logs. I’ve tested it, and it works well. The only area that could be enhanced is the UX for message delivery (I’ve used the Telegram integration). However, I haven’t dug deep enough to see how I could tweak the message, so that might be the raw content of it. 😄
All in all, I’m pretty happy and satisfied with my setup. It works well, it’s open-source, and it’s free. It also meets my expectations.
I hope you enjoyed the article, and happy self-hosting! 🚀 😄
Get notified when I publish something new. No spam, unsubscribe anytime.